
About the Coastal Hazards Community Exhibition
The Victorian Government began a state-wide program of localised coastal hazard assessments with Port Fairy, and in 2013 the Port Fairy Coastal Hazard Assessment was completed. This study identified hazards arising from erosion of beaches and dunes pressing further inland as the sea level rises. Looking forward 35, 65 and 85 years, the study showed that left unchecked, erosion and the rising sea level would damage dunes, houses and facilities along the coastal strip and increase the likelihood of flooding in some inland areas. Biodiversity and recreation, homes and businesses will all be increasingly vulnerable to storm events unless protective measures are put in place to prevent the encroachment of the ocean reaching areas in and around Port Fairy.
The exhibition consisted of six posters, each covering a different area and different coastal environments around Port Fairy. Each poster illustrated the coastal hazards identified with information from the coastal hazard assessment report. Each poster was accompanied by a short survey which asked participants to share their views about Port Fairy and how to treat the identified hazards. The posters were displayed in cafés and other venues around the town from December 2014 until March 2015, providing plenty of opportunities for everybody to have a go.
This exhibition was about the future of Port Fairy’s coastline.
Everybody who’s ever been to Port Fairy knows that it’s a great place to live and a great place to visit. It’s got great beaches, great waves, great fishing, great walking, great sports facilities, great business opportunities, great pubs, great culture, great public open spaces, great whale watching, great heritage, great people all set in a great natural environment. There are a lot of reasons to take great care of Port Fairy’s future.
Erosion has changed the coastline quite noticeably since the millennium, and throughout the last century, and this has not escaped the attention of residents or visitors. The coastal hazard assessment confirms our concerns and identifies the most vulnerable locations around Port Fairy.
In determining how to respond to the identified hazards, Moyne Shire Council and the Victorian State Government are committed to engaging with the community. What’s important to you and your views about the future for Port Fairy’s coast will be a factor in the decision making process.
Local residents and Port Fairy visitors were urged to study the posters and complete the series of short surveys to give a broad perspective on what’s most important about the local coastline, and how to treat the identified hazards. See a summary of the Exhibition below.
The Analysis & Report
The data has now been analysed and a report presented to the Moyne Council Working Group. The Council will make use of the survey results as it develops the Port Fairy Coastal Adaption Plan which is planned for completion in September 2015.

Area Map
For the purpose of the exhibition the study area was divided into 6 different zones each with a set of unique threats that were described on the posters.
Area 1: East beach: north, Belfast Lough and the Golf Club
Area 1: Summary of hazards
This area is indicated on the key map above as the stretch of East Beach from Reef Point to the northern most tip of the rock wall protecting the properties on top of the dune.
Erosion hazards (shown in shades of red/orange) include the possible exposure of waste materials from the two tip sites, as well as a dune at risk of being significantly eroded. Two areas are shown on the map as possible breaching of the dune in what would be considered a failure of the protective measures. In this event the Lough would be open to ocean.
Inundation hazards (shown as shades of blue) represent the increasing future risk, the key map to the right gives a time frame determined by experts with the link to the Port Fairy Coastal Hazard Assessment available. As can be seen, however, the potential for flooding of the area is significant with the airstrip, private property and the golf course all under varying degrees of threat.


Area 2: East beach: central
Area 2: Summary of hazards
This area is indicated on the key map above as the stretch of East Beach from the northern tip of the rock wall to the surf club. It extends back to the flood plain of the Moyne River.
Erosion hazards The map below assumes that the rock wall is maintained and protects the housing on the dune, there is no question that erosion of the dune would occur as per diagram B below if the wall were allowed to fail. Sand loss due to increased storm frequency and intensity is expected so a reduced beach width is a real possibility.
Inundation hazards (shown as shades of blue) represent an increasing future risk, the key map to the right gives a time frame determined by experts with the link to the Port Fairy Hazard Assessment available. As can be seen, however, the potential for flooding of the area is significant with both private and public property under threat.
Wave run up
Sections of the subject area where the rock wall is interrupted to allow vehicles onto the beach are at risk of wave run up during storm events.


Area 3: East Beach: South Port of Port Fairy
Area 3: Summary of hazards
This area is indicated on the key map above as the stretch of East Beach from the Surf Club to Battery Point, it also extends back over the river to include Gipps street. Much of the Port and associated infrastructure is included in this area.
Erosion hazards The map below assumes that the rock wall is maintained and protects the housing on the dune, there is no question that erosion of the dune would occur as per diagram B below if the wall were allowed to fail. Sand loss due to increased storm frequency and intensity is expected so a reduced beach width is a real possibility.
Inundation hazards (shown as shades of blue) represent an increasing future risk, the key map to the right gives a time frame determined by experts with the link to the Port Fairy Hazard Assessment available. As can be seen, however, the potential for flooding of the area is significant with both private and public property under threat.
Wave run up
Sections of the subject area where the rock wall is interrupted to allow vehicles onto the beach are at risk of wave run up during storm events.


Area 4: Griffiths Island
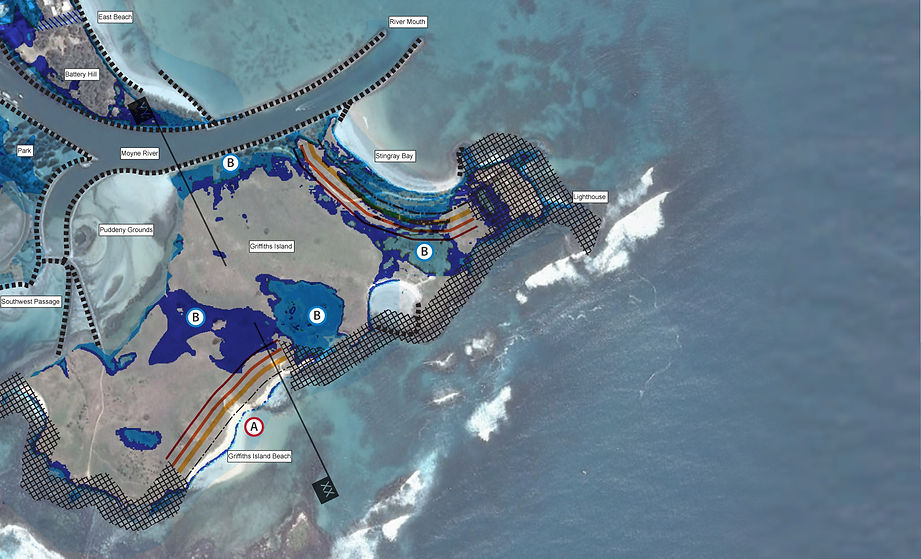
Area 4: Summary of hazards
This area covers all of Griffiths Island and the adjacent car parks/structures. Hazards identified in the Port Fairy Coastal Hazard Assessment are limited to mainly environmental concerns with some threat to public property adjacent the Southwest Passage.
Erosion hazards (shown as shades of red/orange). The dune and walking tracks around the island are potentially under some erosion threat with some identified hazards already showing some evidence of impact on the dune.
Inundation hazards (shown as shades of blue). represent an increasing future risk, the key map to the right gives a time frame determined by experts with the link to the Port Fairy Coastal Hazard Assessment available. The potential for flooding in and around the island is primarily a concern for the natural habitat of animals such as the Shearwaters (Mutton birds).

Area 5: Pea Soup beaches, Folk Festival areas, Russell Clark reserve
Area 5: Summary of hazards
This area covers the stretch of rocky beaches from Martin's Point to just east of Powling Street. Importantly it also shows the low lying areas behind the dune that host many activities from child care to sports events to the Port Fairy Folk Festival grounds.
Erosion hazards (shown as shades of red/orange). Sections of the dune where a rocky cliff shoreline aren't present are indicated as being at threat from erosion. The majority of the erosion threat is to the unpopulated dune behind the camp ground however there is some threat to property to the east of the map.
Inundation hazards (shown as shades of blue). The topography behind the dune is quite low and can be seen as a significant risk to flooding, increasing with predicted sea level rise. The areas under threat here range from residential, recreational to sports and cultural events such as the folk festival (shown here in full swing)
Wave run up (shown as diagonal blue lines). These areas are potential weak points in the dune or coastline being smaller in size, open to large waves, or subject to the 'seawall end effect' where the dune at the end of a seawall suffers increased erosion.


Area 6: Ocean Drive and South Beaches
Area 6: Summary of hazards
This area covers the stretch of rocky beaches from east of Powling Street to the properties accessed from Thistle Place. It includes a low lying area of Ocean Drive at significant risk of wave run up.
Erosion hazards (shown as shades of red/orange). Sections of the dune where a rocky cliff shoreline aren't present are indicated as being at threat from erosion. The majority of the erosion threat is to the west of the map where the properties are above a dune already showing signs of erosion. An attempt at slowing the erosion has been made by placing rocks at the base of this dune however the Coastal Hazard Assessment regards these as being inadequate.
Inundation hazards (shown as shades of blue). The topography behind the dune is quite low and can be seen as a significant risk to flooding, increasing with predicted sea level rise. The areas are mostly open fields however some areas are quite low lying and already have private properties within the risk area.
Wave run up (shown as diagonal blue lines). Area 6 reveals a significant area under threat from wave run up. Although there is an outer reef (shown in the section below) it is expected that during a significant stom event the waves will top the dune which is quite low. Currently there are no protective measures in this area which contains many residences.

